Section 2 Introduction
2.1 Quantitative methods
The methods introduced in this part of the course differ from the qualitative methods that are explained separately. As the name itself indicates, here the focus is on quantity of observations rather than some quality of a particular observation. The dichotomy of the two distinct kind of methods is summarized as a table below.
| QuaNTitative | QuaLitative |
|---|---|
| Numeric data | Semantic data |
| Large-N | Small-N, case studies |
| Generalize | Explore |
| Measure and test | Understand |
| Statistical analysis | Interpretation |
Whether we should apply a quantitative or qualitative method usually depends on the data we are seeking to analyze. If our data includes a large number of observations, it is feasible to express each of them numerically. If we only have data on one or several observations, we can and need to treat them semantically, i.e. find meanings rather than attempt to summarize them.
As a result, qualitative methods can only be used to explore the observations that are available to us. If our aim is to generalize findings to an unobserved population, we need to use quantitative methods. Thus, in the latter case we measure our observations and test the differences between them, rather than attempt to understand or interpret each of them separately.
2.2 Statistics
Quantitative research methods can be summarized with the term “statistics”. This can refer to the numeric nature of data or to the techniques applied to analyze such data. See Navarro and Foxcroft (2018) sections 1.1 and 1.5 for a brief explanation of why we use and need statistics. Sections 2.3-2.7 are more lengthy but also provide useful background on validity and reliability of statistical methods.
Dash (2016) has summarized statistics as follows:
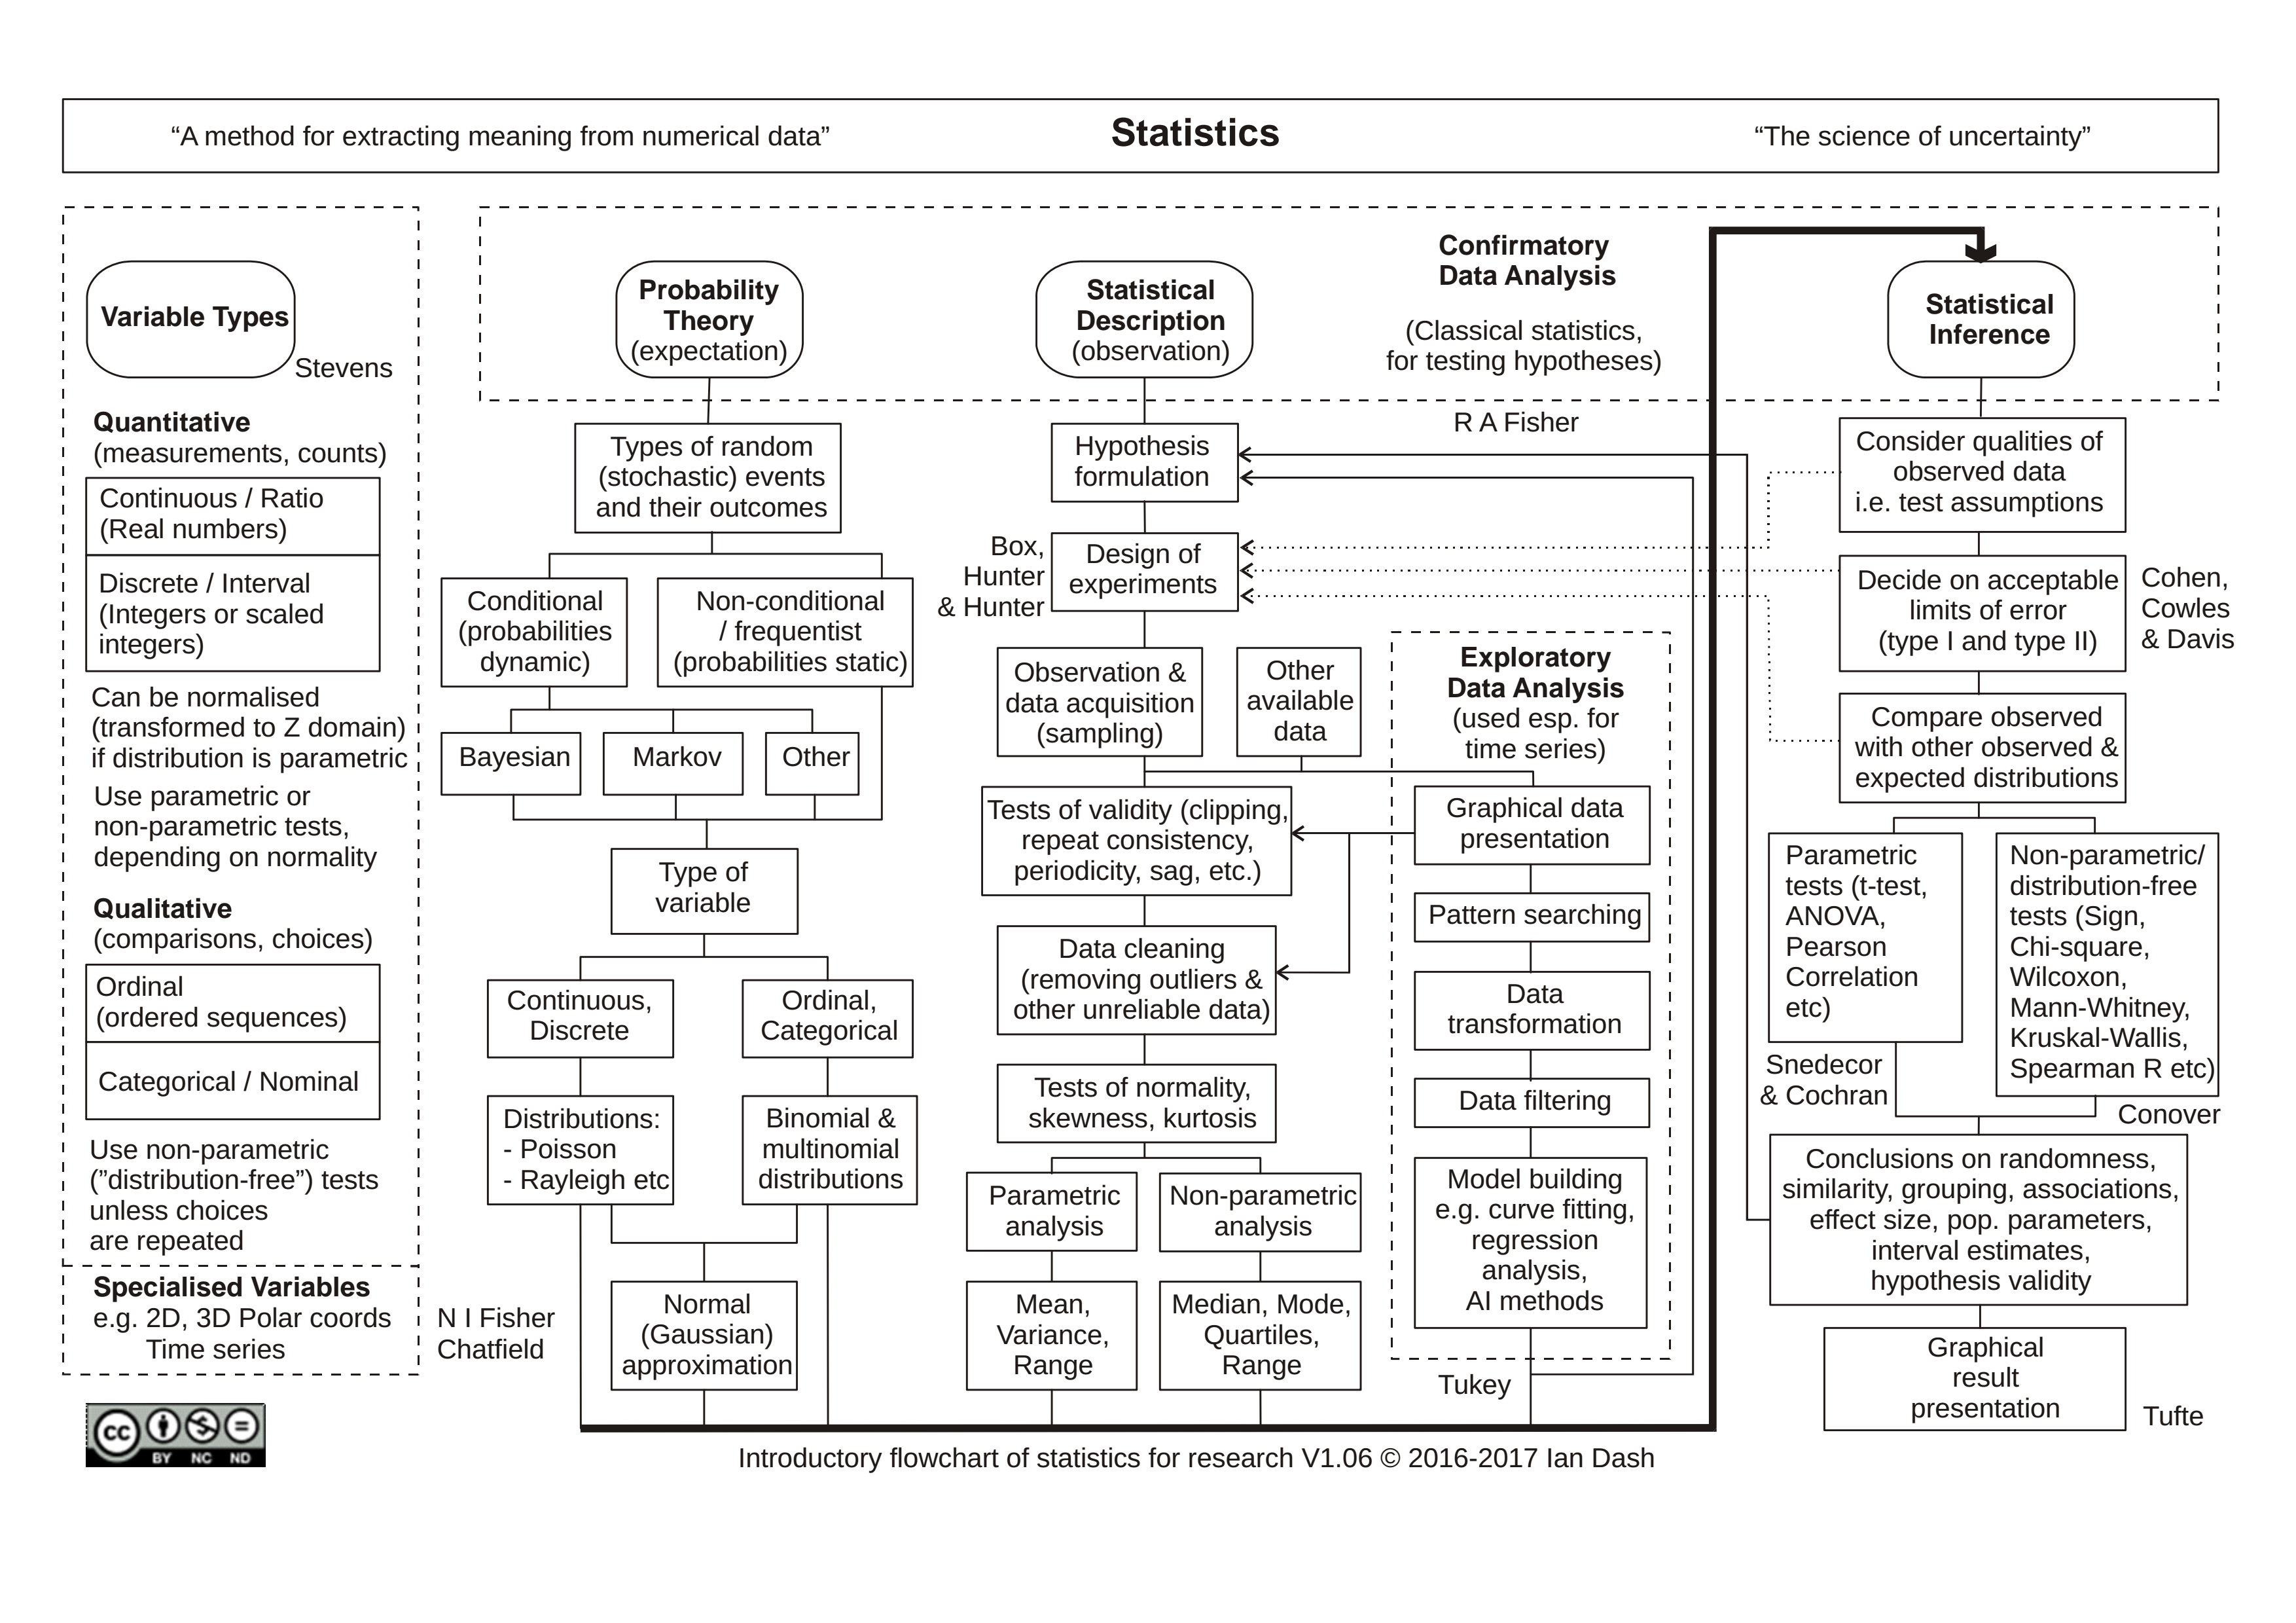
Figure 2.1: Flowchart of statistics
Some ways to think about different approaches to statistics are explained as follows.
2.2.1 Descriptive and inferential statistics
Statistics can not only be used to describe the data we have but also to infer wider conclusions from that data with a certain degree of certainty. While descriptive statistics methods use simple measures, inferential methods involve mathematically and conceptually more complex procedures. These allow us to derive point estimates and intervals that we may also apply to observations outside our data set. Most of the methods introduced during this course will be inferential.
2.2.2 Frequentist and Bayesian approach
In this course we only examine the more common Frequentist methods that are based on the work of Ronald Fisher (1890-1962) and dominate the research to this day. In contrast to Bayesian approach, the methods we will learn do not condition estimates on some prior knowledge and only apply a single inference rather than multiply them for a posterior estimate. Not very intuitively, the Frequentist analysis tells us about the probability of data given an estimate, and not directly about probability of an estimate as in case of Bayesian approach.
For a more thorough explanation of Bayesian statistics you can read Navarro and Foxcroft (2018) section 16.
2.2.3 Statistics and data science, machine learning, artificial intelligence, …
This course will focus on the research methods applied in social sciences. Because in academic research the aim is commonly to explain phenomena, we will not discuss solely predictive methods applied in fields such as data science, machine learning and artificial intelligence. Thus, we will only learn methods that assume small and clean data sets and the use of mathematics and simple calculations rather than programming and complex algorithms.
2.3 Software
In case of software for statistics, the most basic distinction can be made between spreadsheet software and statistical packages. The former are mostly used to manage two-dimensional tables of data and run simple calculations on them. For more sophisticated statistical analysis, it is necessary to use a dedicated application or a programming language. Some commonly used software for statistics includes the following:
- Spreadsheet - table management (e.g. Microsoft Excel, Google Sheets, LibreOffice Calc)
- SPSS - simple GUI-based app with limited functionality
- R - extensible programming language designed for data analysis
- Stata - Mostly CLI-based, well suited for econometrics
- SAS, Matlab, Statistica, …
2.3.1 Jamovi
During this course we use Jamovi app to implement the methods in practice.
Jamovi is a new “3rd generation” statistical spreadsheet. designed from the ground up to be easy to use, jamovi is a compelling alternative to costly statistical products such as SPSS and SAS.
Jamovi is built on top of the R statistical language, giving you access to the best the statistics community has to offer.
You can try it online without installing at https://cloud.jamovi.org/.
2.3.2 R language and RStudio
As an alternative to Jamovi, students are free to use R programming language. Due to its steep learning curve, it will not be taught during meetings.
R is a language and environment for statistical computing and graphics.
R provides a wide variety of statistical (linear and nonlinear modelling, classical statistical tests, time-series analysis, classification, clustering, …) and graphical techniques, and is highly extensible.
2.4 Notation
The notation below is used in these notes.
\(n\) - sample size (number of observations in sample)
\(N\) - population size
\(\bar{x}\) - sample mean
\(\mu\) - population mean
\(\hat{\mu}\) - estimate of the population mean
\(s\) - sample standard deviation
\(\sigma\) - popuation standard deviation
\(\hat{\sigma}\) - estimate of the population standard deviation
\(x\), \(y\) - random variables
\(\hat{y}\) - estimated values of variable \(y\)